
Michelle Obama announced her “Let’s Move” campaign, an effort to fight childhood obesity by promoting healthier eating and physical activity among kids, five years ago Monday. But the most recent data show that driving down childhood obesity rates is proving to be an elusive goal.
Obama’s challenge was steep: Overall childhood obesity rates tripled in the past three decades, climbing from about 5% in 1974 to nearly 17% by 2008, according to the Centers for Disease Control and Prevention. All told, 12.7 million children were considered obese when “Let’s Move” got underway in 2010.
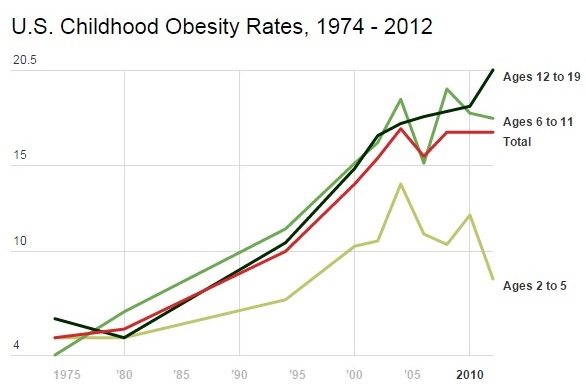
How are efforts to fight childhood obesity doing?
As the chart below shows, the results are mixed: While childhood obesity among children between two and five years old dropped 3.7% from 2010 to 2012, the rate increased 2.1% for children 12-19 during the same period. The overall childhood obesity rate, meanwhile, remained at a constant 16.9% from 2008 through 2012.
If there’s a silver lining in the numbers, it’s the reduction in obesity among very young children. If kids are being taught healthy habits at a younger age, they’re probably more likely to carry those behaviors into grade school and beyond, public health experts say. If that trend holds true, we should start to see a similar drop in obesity among older children over the next few years.
via This Chart Shows How Hard It Is to End Childhood Obesity | TIME.